Tableau Project - Analysis and Visualizations for a Retail Company
Written on August 24th, 2024 by Aashay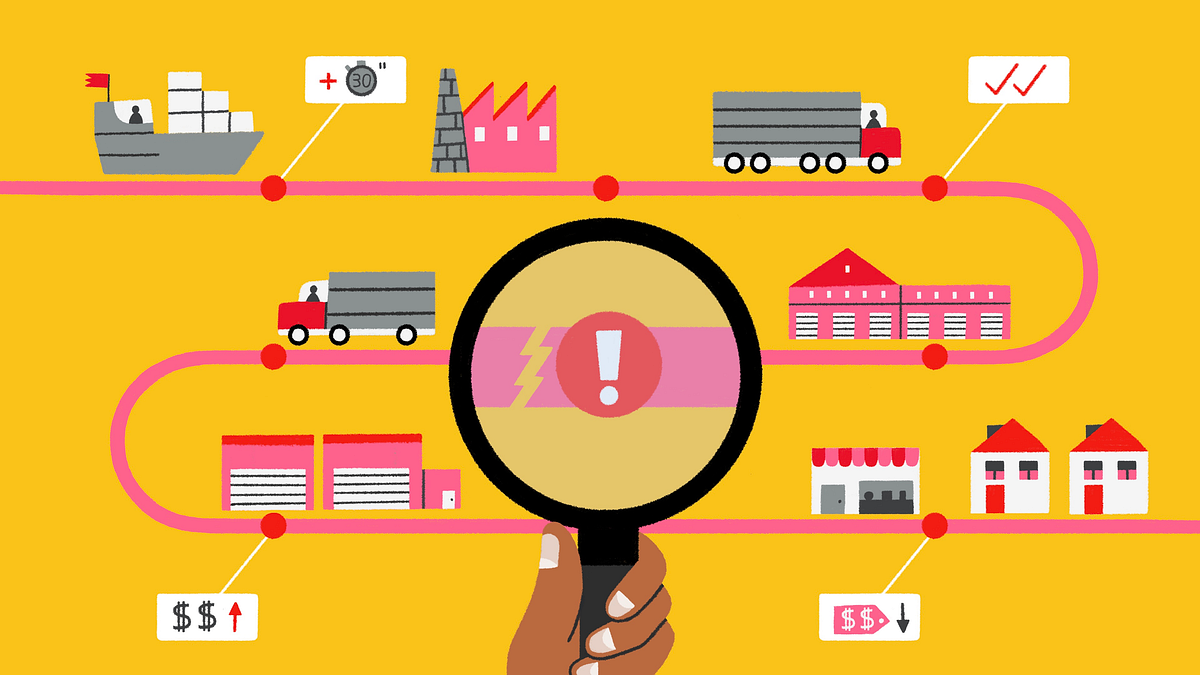
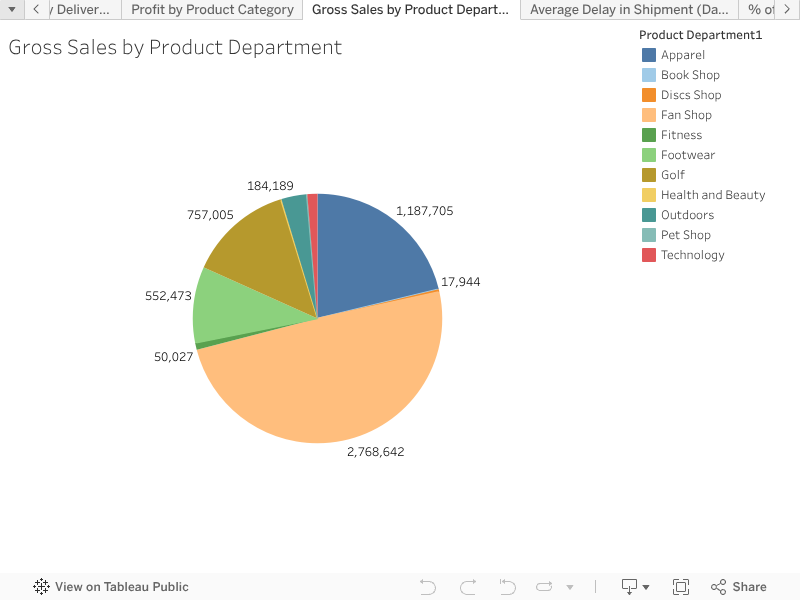
Interactive Tableau Visualizations
Project Overview
The Supply Chain Analytics project was designed to address key challenges in order fulfillment, shipment delays, and inventory management. By analyzing datasets related to orders, fulfillment times, and inventory levels, we identified inefficiencies and provided actionable insights through interactive dashboards. These dashboards offer a decision-making tool for stakeholders, enabling them to promptly identify issues and implement strategic solutions to enhance overall business performance.
Datasets and Methods
- Orders and Shipments Dataset: Contains detailed information on each order, including customer data, order dates, and profits.
- Fulfillment Dataset: Records the time taken by warehouses to fulfill orders.
- Inventory Dataset: Tracks inventory levels, costs, and warehouse details.
We utilized a combination of data cleaning, descriptive analysis, hypothesis testing, and linear regression to extract meaningful insights from the data. The results are visualized using interactive Tableau dashboards that focus on key supply chain metrics such as shipment delays, inventory levels, and profit margins.